Our take on mobile fraud detection
Jampp’s mission is to help companies grow their mobile business by engaging users and driving new customers. Combatting mobile fraud is a top priority to ensure this is possible. Other than spamming, phishing and scamming, ad fraud is one of the most profitable scenarios for rogue internet users. Mobile fraud forecasts for 2016 vary along $1.25bn (Forensiq) and $7.2bn (ANA). Yes, you’ve read that correctly: impact is on the order of billions of dollars.
What is it and how can it be done?
The mobile ad business is fairly simple in monetary terms, some people, namely advertisers, pay to place their ads in a site whose owners we will call publishers. There’re a whole lot more players in between and around, but we’ll keep it simple for the moment. Publishers are the ones offering their advertising space for sale and advertisers are essentially bidding for that space. Most pricing models across the industry are proportional to ad impressions, click volumes and, recently, generated installs.
Technically speaking, clicks or impressions are not exactly what people would commonly think of. Under normal conditions clicks, impressions and events are HTTP requests being made between devices and servers, in response to user actions. To exemplify this, a simple diagram is given below. Here a click request bounces around different servers, one for each actor in the mobile advertisement ecosystem.
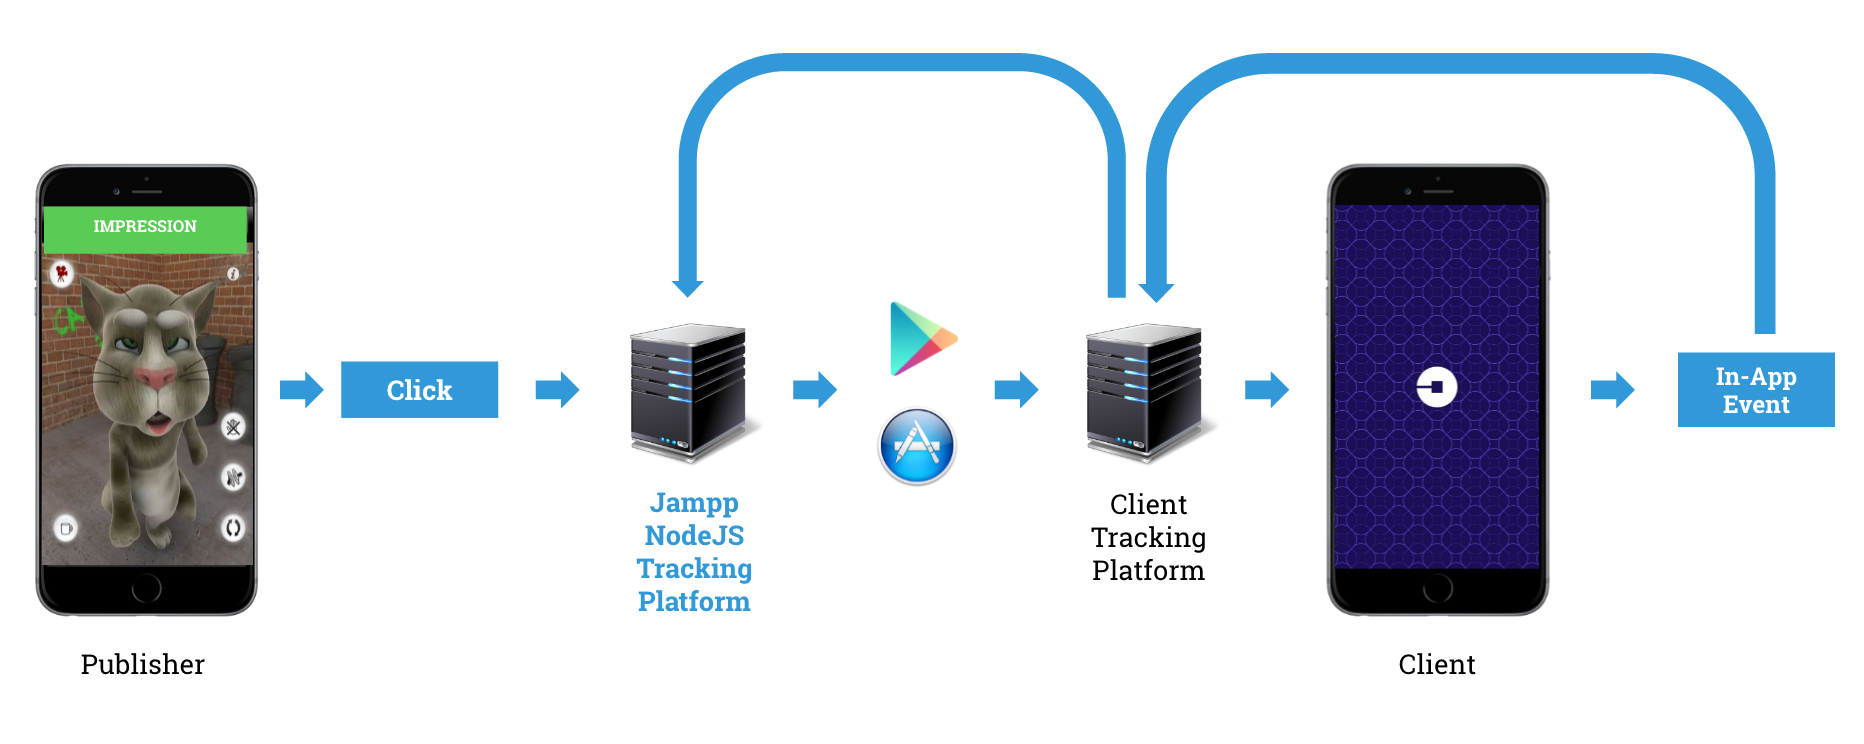
The user initially clicks on the ad and its user agent, device ID and other metadata are being URL-encoded in the request. Their request is passed along the chain until it is finally redirected to the App/Playstore where, ideally, the user would install 1 and open the app. Then, an event-tracking SDK integrated to the advertiser’s application would report this type of in-app events back along the chain of requests. This action is named a postback request, which informs everyone that a user has opened the app, thus prompting an install.
The difficulty relies on actually verifying that the user’s reported action effectively happened and wasn’t just simulated. In all cases, this means establishing that a real touch on the screen or even an ad view. Faking a request or a real action is essentially not difficult.
Given the rules, costs and benefits of this game, you can imagine why scammers feel so encouraged to do their job. There you have it, that is mobile fraud.
Fraud Categories
The Invalid Traffic Detection and Filtration Guidelines Addendum made by the MRA and the Mobile Marketing Association (MMA) defines two big categories of fraud according to their technical nature:
General
A “consistent source of non-human traffic”. This is covered by mobile bots, traffic from data center, virtual machines and traffic from proxies or VPNs. 2
Sophisticated
Its defined by the property that significant human analysis and intervention are needed in order to detect it. The addendum’s non-exhaustive list includes certain examples like “hijacked devices; hijacked sessions within hijacked devices; hijacked ad tags; hijacked creatives; adware; malware; incentivized manipulation of measurements; content; falsified viewable impression…”. The common denominator being that there is an real user in the scheme, but the ad is not served correctly.
Simply put, most of the traffic involved in the general fraud category would be originated when a scammer runs programs that imitate mobile devices and human behaviour interaction with advertisements. The programs behind these schemes consist of obvious random-http-request scripts generating requests with tokens tuned for each specific source or ad network. General fraud traffic is represented in the type of invalid traffic from data centers, VPNs, malware and other similar scenarios where programs are impersonating human actions like viewing and clicking ads or even installing and generating in-app events. Typical countermeasures for this type of fraud involve using ip blacklists, user-agent filtering, checking correct device-id formats, and other direct filter measures.
Hummingbad malware campaigns are a recent example of sophisticated invalid traffic. Using rootkits, the malware gets to command and coordinate a huge botnet across millions of devices, generating most of its revenue from app installs. Yingmob is the organization responsible for this scheme employing up to 25 people in different project groups. The organization’s professional structure behind the campaigns involved managing interactions between highly complex modules and across different technical teams.
Fraud Objects (Sites or IPs)
By the arguments we mentioned before, one could assume that a scammer would represent theirself either as an IP or through a publisher/site. In some cases, also looking at device ids as possible fraud objects could be more favorable but even these are easily falsifiable and, in the end, the advertiser’s budget is going to the publishers. And here is where the scammer will be cashing their rewards. For the rest of this post we will be focusing the analysis on these two data points because masking IPs is not a simple task and because the publisher information is reliable (otherwise a scammer would never cash in their rewards).
Fraud Types
For this post, we will be looking at anti-fraud tools against both forms of invalid traffic, with focus on the following fraud types: Click Spamming, Mobile Hijacking and Action Farming 3.
A brief outline of each type is given below.
Click Spamming
This type refers to programs that generate fake click requests programmatically. A scammer would first run tests to extract appropriate campaign URL tokens for a specific device type or location. Next, it would execute programs to generate a high volume of click requests, randomizing device-IDs and user agents at each iteration. The idea is to cash in from these requests and, as a surplus, randomly nail a would-be-organic install. The typical consequences of this scenario would be having huge volumes of clicks and impressions, low CVRs and high volume coming through a few network points or sites.
Mobile Hijacking
This happens when a user’s seemingly genuine app runs hidden ads and clicks in the background. In general, the program would be scripted to imitate human behavior as much as possible. The problem is that all common data points look valid i.e., the IP address and user-agent, as well as the device ID. The idea is that would-be-organic installs from this user will be then incorrectly attributed to this publisher. This scenario would generate high volumes across clicks and impressions. Low CVRs and better-than-average user activity are expected as well. Also, given that a scammer can’t control when the install is organically made by a user, the time delta analysis from click to install would result in very atypical distributions at the fraud object’s level (either publisher or IP).
Action Farms
The idea behind this scheme is fairly simple. Scammers would reward people all around the world for clicking ads and installing apps manually i.e., actual people are hired to click on ads and install applications. The amount of events to be reached by this scheme will definitely not be as big as in programmatic schemes, but put in monetary terms, where one install might equal one dollar means three hundred fake installs a day is no joke to any campaign’s budget.
We have even tracked cases to social network groups where people were openly being hired to “get paid for installing applications!”.
Fraud Metrics
Most of the obvious countermeasures are already standard across the industry: IP filtering, publisher blocking, foreign click filtering and detection of spikes in click or install requests. To add on these tools and concretely target the types of fraud we mentioned above, we expanded on a new set of detection tools.
Population Ratio
Given that IPs have the ability to be geolocated up to a certain extent, we can match an action’s IP to a region and compare the region’s population size vs the amount of clicks coming from that IP. This metric is simple but in some cases not reliable. There are times when click IPs are incoming from mobile carrier exit nodes situated in low density regions and where each node concentrates a big big part of the carrier’s traffic. A brief example of this tool is given below, this test was carried out on clicks with no fraud filtering and the top rates are shown:

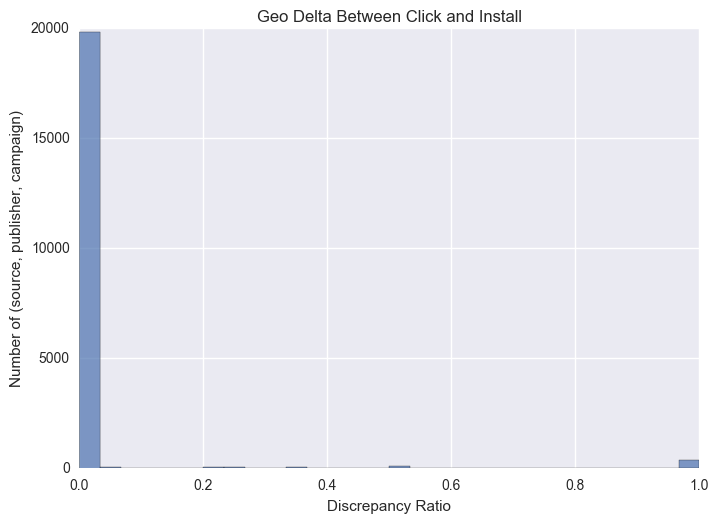
Similar to the metric explained before, we compare geoIP regional mismatches between different actions, comparing across impressions, clicks, installs and events. This metric is expected to uncover only a few discrepancies because, as we mentioned before, masking an IP in a request is a difficult task and filtering invalid traffic this way is a common industry practice. In our experience, this ratio is rarely “unusual”, having average differences of the order of 0.7%. The following histogram shows geographical average mismatches at the publisher and campaign levels. A sample of 20k click-installs was used for this analysis.
When focusing on the top discrepancy cases in unfiltered traffic, we are encountered with the following results which highlight differences in click and events geolocations:
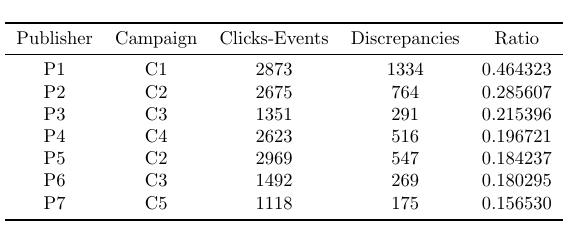
Notice that even though publishers are not the same, some campaigns appear more than once in this head. This type of information would raise suspicions towards click spamming or action farming where scammers would be resetting their IP address to hide high volumes of traffic from a single IP, thus creating a discrepancy with the past IP used for the click.
Time Delta
This relatively new metric has been in use by the people at Adjust and Kochava. It is built by measuring the seconds it takes between any two consecutive actions, for example from click to install. Note that this metric has already gone deeper in the funnel, giving specific information on every particular install. The idea behind this metric is that, in general, counting data gives rise to empirical distributions with specific properties. Most of the distribution’s mass would be concentrated in lower values and the decay would be exponential at first and almost constant at higher values. An example of this metric is shown below, where time between a click and an install is measured:
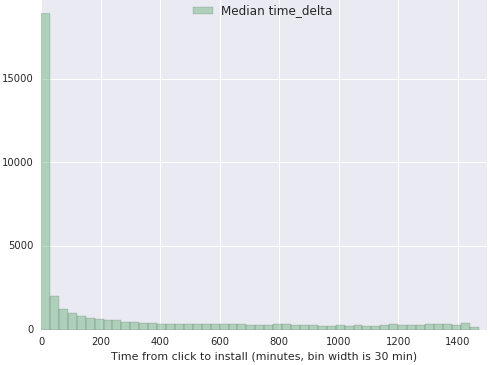
The histogram shows a sharp decay for the lower values of the metric with an almost constant decay value for higher time deltas. These type of distributions also appear when focusing the analysis on specific applications. The following example is taken from the Classifieds vertical where the fraudulent publisher has been excluded:
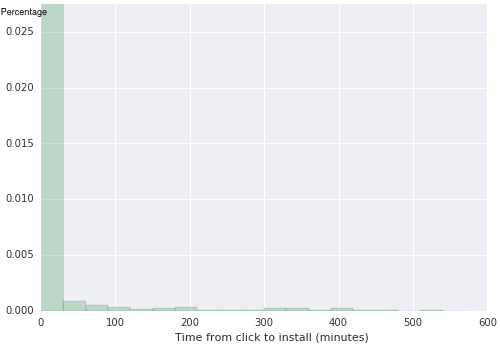
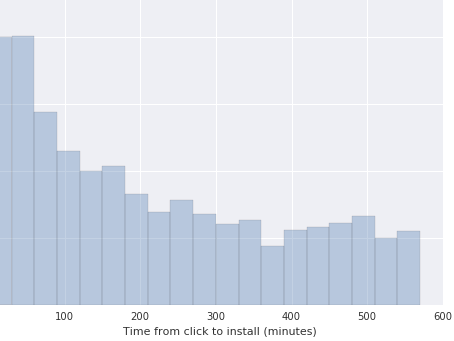
Notice that the two histograms shown before are essentially very similar in terms of their statistical moments when compared to more fraudulent samples. Once we focus on the fraudulent publisher, we find that the empirical distribution has evidently changed, and this change is reflected in statistical tests.
Performance Metrics
For this tool, we are assuming that faking a device ID at the tracking platform’s SDK level would be a difficult feat. Thus we will be looking at click and install volume, CVR rates and the number of unique device IDs making installs in a given time interval. The idea is to see if there are significant anomalies when segmenting traffic per publisher or click IP.
These metrics are simple and based around standard industry metrics. Comparing top and bottom performance notches for each performer would give an insight into the condition of the traffic being acquired. However, it’s important to take special care before tagging an object with unusual behavior because it is common to have notable differences amongst verticals, sources and applications. Let’s see what unfiltered traffic would look like:

Here observations are ordered by click volume. Notice the high volume incoming from the same IP range. Unique device ID rates look healthy though for this range, with a handful of cases where one device ID has multiple installs. However, the first row is more suspicious when you consider that, in average, every device ID using this specific IP has generated 1.3 installs.
Some Final Comments on the Nature of Fraud Detection
By now, it might have become evident to the reader that mobile fraud is, in essence, an unsupervised problem. There is virtually no data, other than the obvious cases, to label any given click, install, view, or in-app event as fraud in an automatic, non-intrusive way. This concept is fundamental to the issue at hand. Looking at the techniques used in other industries, say banking, health or finance, some of them would have access to specific fraud cases (picture a credit-card charge dispute for instance) where fraudulent actions are duly tagged. For the rest of the cases they’d need to rely on unsupervised techniques.
As an example, imagine we measure some variable that tests out to be normally distributed. Then a toy anti-fraud tool would label all cases outside the 99.7% band. This is called outlier or anomaly detection 4 and the spirit is that, in a normal distribution, this band value equals to three standard-deviations from mean. But why is this band chosen? Should we choose two, three or four standard-deviations? What is standard about a standard-deviation? What if our distributions have fat-tails? (DISCLAIMER: yes, this is our case). The same goes for all statistical tools in Extreme Value Theory or Anomaly Detection: their applications must be handled with care and with attention to context (one measurement might be atypical in one context but not in others ). To sum up, there is no mathematically correct definition to characterize outliers, and by this, human input is inherently needed for the problem.
References
-
Here an install is defined as the user’s first in-app event reported by the tracking platform. ↩
-
There are legitimate cases of traffic coming from these sources such as from large organizations, universities and such; however this is not the general case. ↩
-
We’ve evolved the term click farm into action farm to better suit the mobile world since having people manually click, install and use an app is also carried out as fraud. Remember that payback on installs is significantly higher than on clicks or views. ↩
-
For a more accurate and complete overview of anomaly detection, a very useful survey on the topic can be found at http://cucis.ece.northwestern.edu/projects/DMS/publications/AnomalyDetection.pdf. ↩

