
How to help your teams to leverage data by using the perfect graphs.

We’ve written posts about retrieving data, and storing and using data. Us and a lot of other people. These days, it’s all about the data. We process +100 TB of data per day, feeding a machine-learning algorithm that allows us to drive incremental sales for app marketers. Data makes the performance marketing world go round. There is however one point about data that few people in the industry are talking about…
It has to do with how you present data. How do you share data with others so that trends and implications can be easily understood by everyone (regardless of their analytical savviness).
Oftentimes, we find that key insights get lost in overly-complicated charts and graphs. Because of that, at Jampp, we created our own Matplotlib wrapper: JPlotLib. Now everyone in our team, can quickly access and use a customized, Jampp branded Python library to introduce data results with little to no effort. In this post, we include several examples of data visualization, we hope you find it useful!
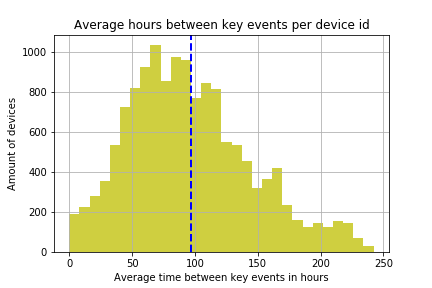
Before, with an open source library defaults…
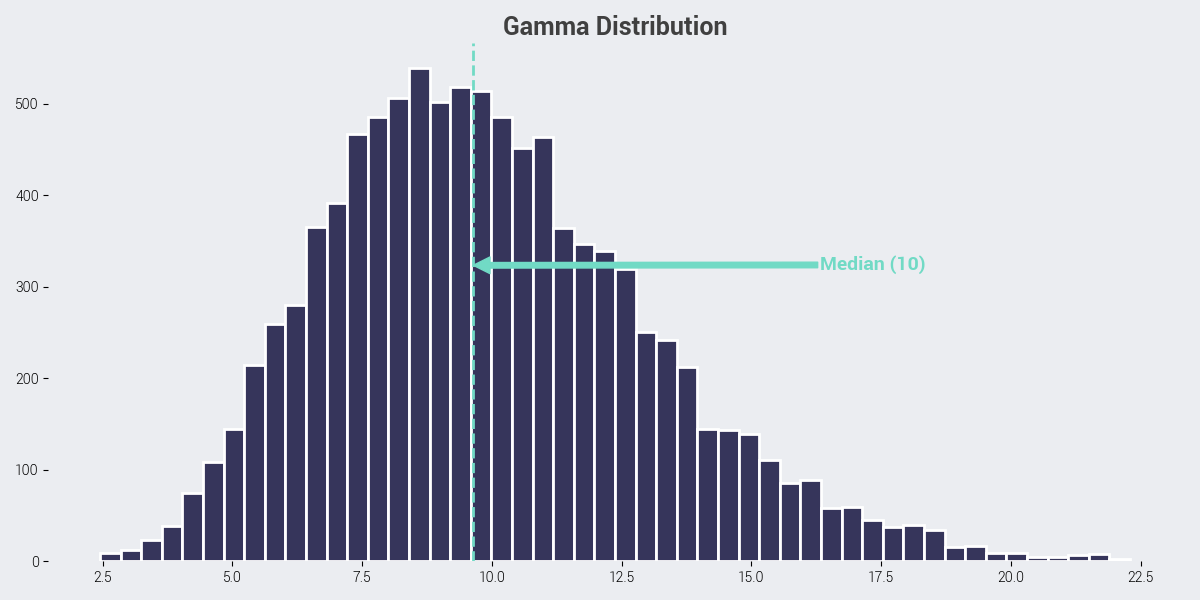
After, with JPlotLib:
At this point, you might be wondering: but why? There are libraries that already have what you need. But do they really? We create tailored data-sets, analyzing user behavior and patterns from millions and millions of data points and let’s be honest, it’s hard to find ones that actually offer good and highly customizable data visualizations. What’s more, some of these have tons of documentation and bugs, which means changing small details requires a lot of manual labor.
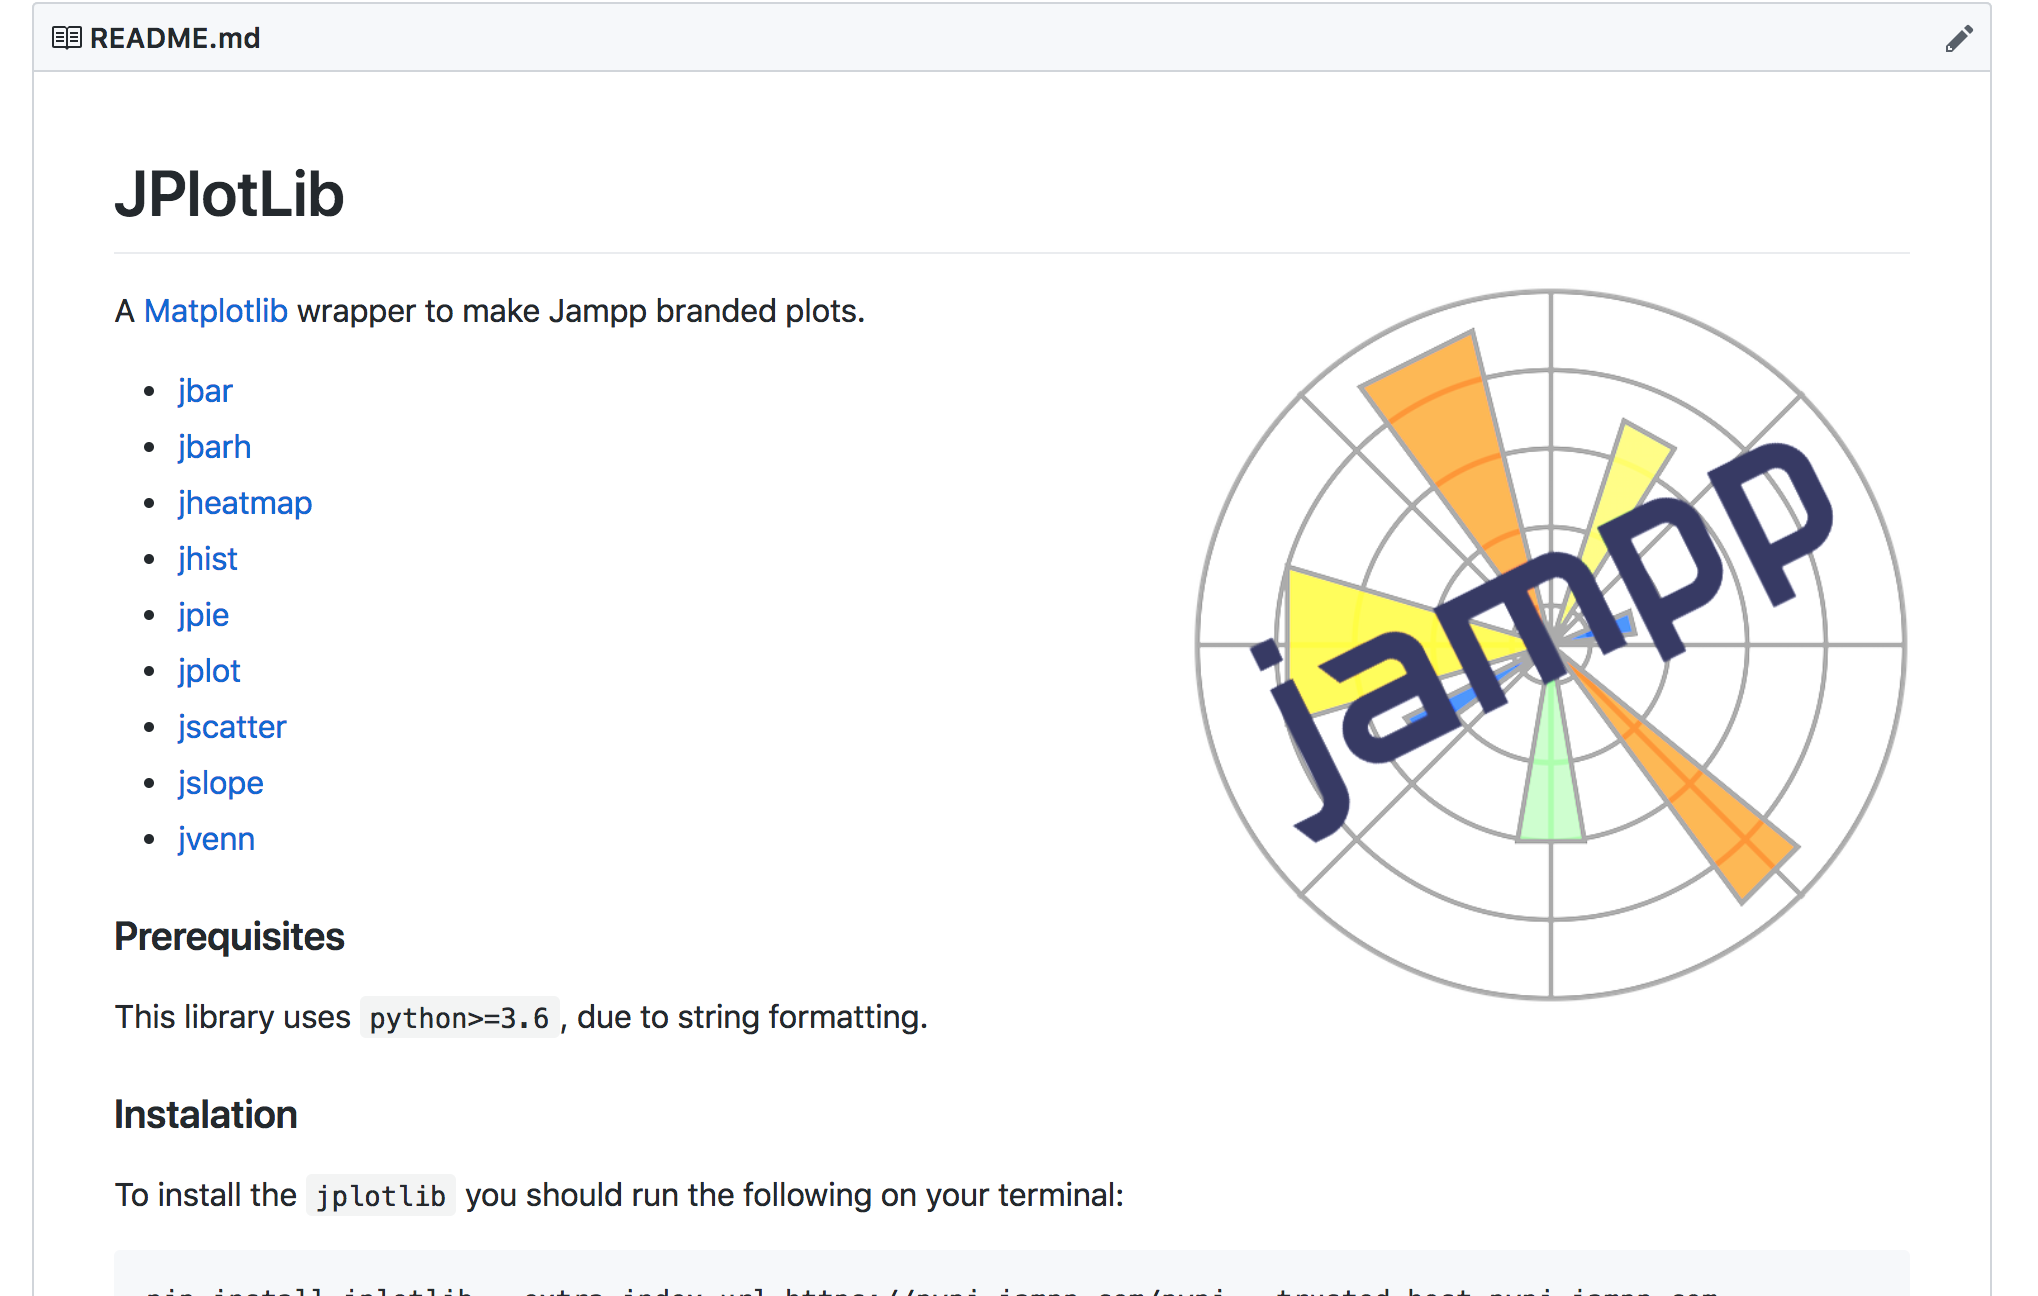
A detailed README with example plots and its corresponding code goes a long way to improve user experience.
Extreme-Makeover, Jampp edition
It’s not just how it looks, it’s how you see it, meaning how easily you can grasp what the graph / chart is trying to show. Improving your plotting tools can make a huge difference!
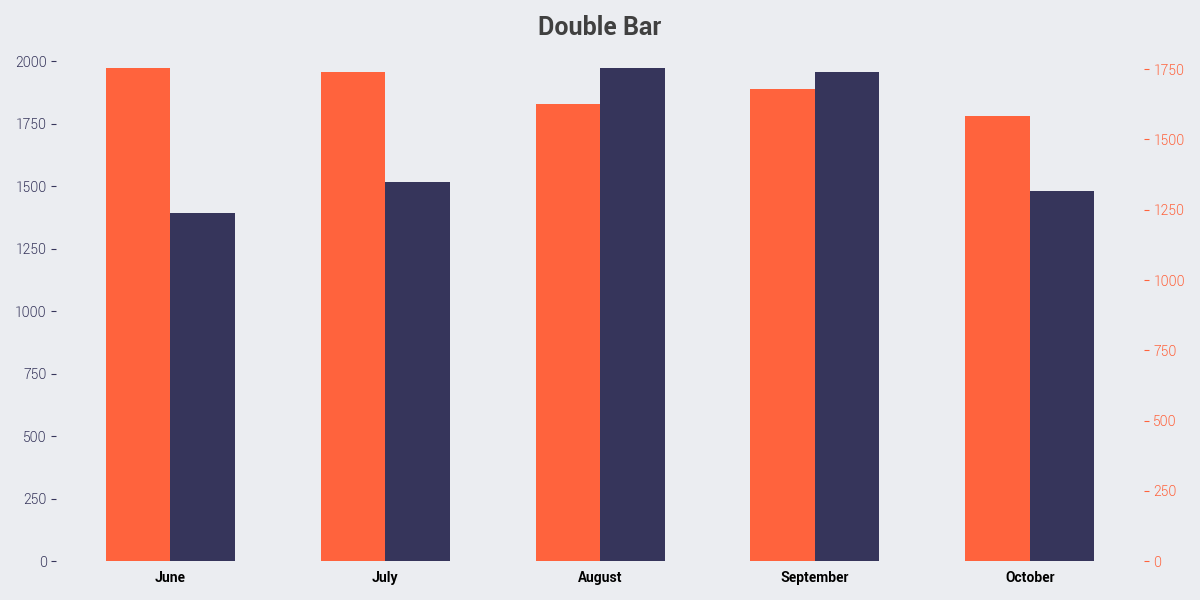
Bar Plot
Before
After
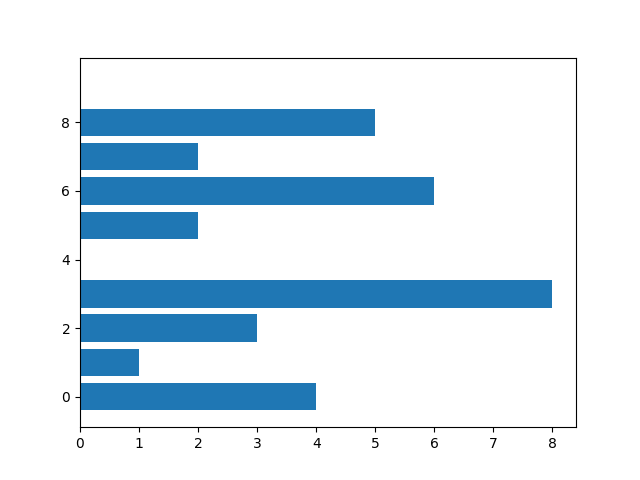
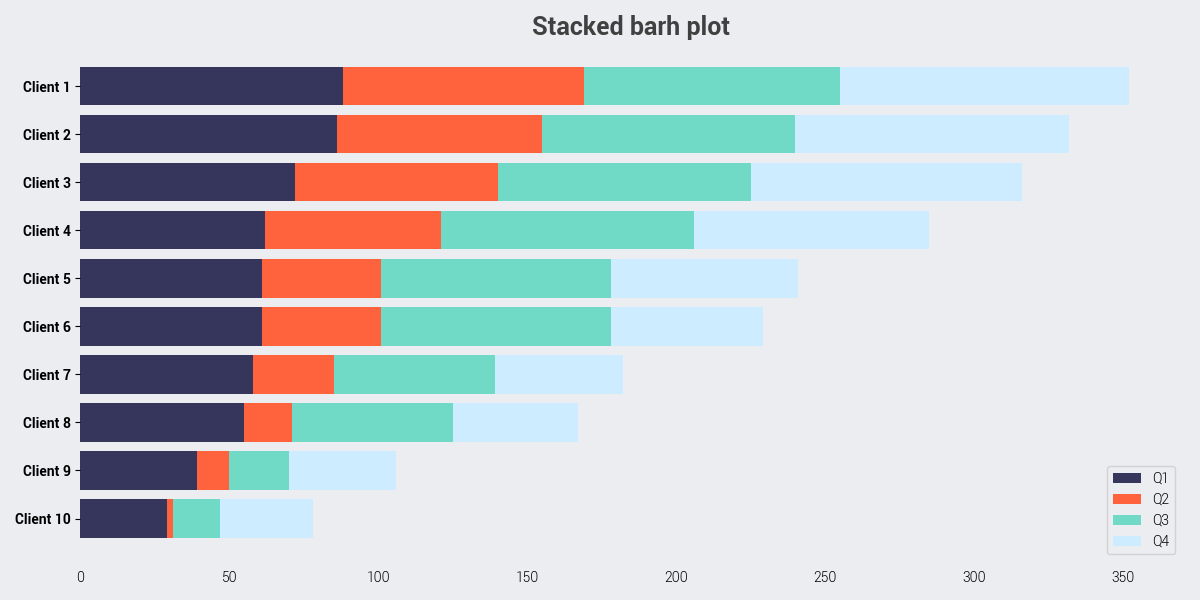
Barh Plot
Before
After
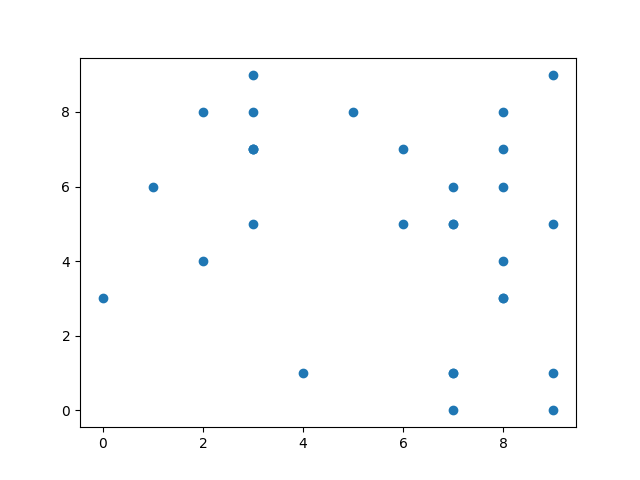
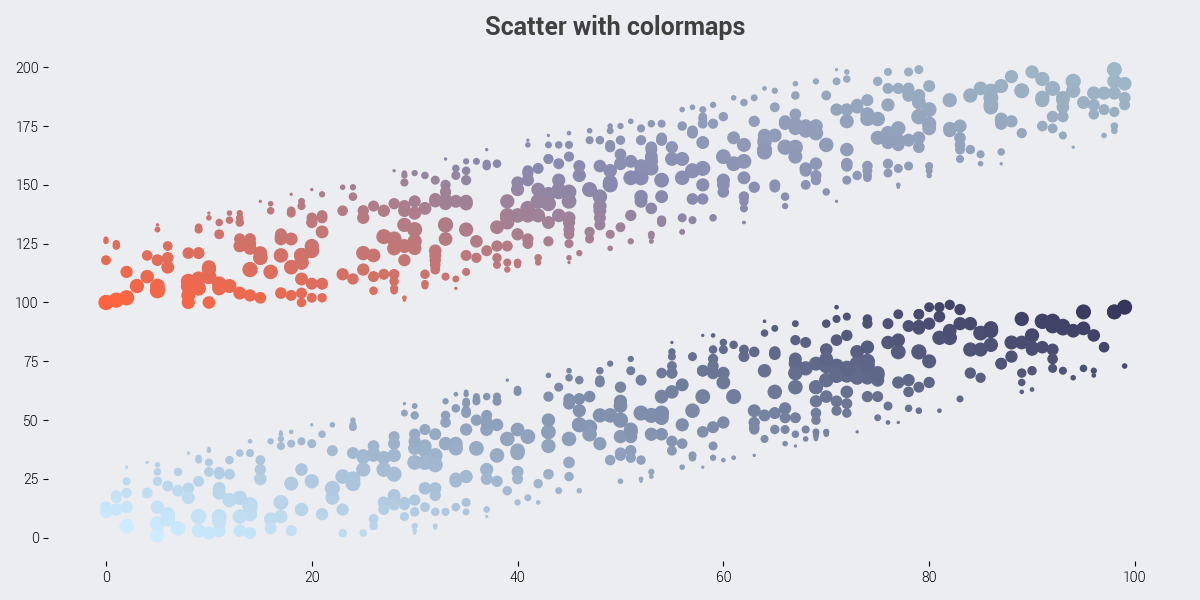
Scatter Plot
Before
After
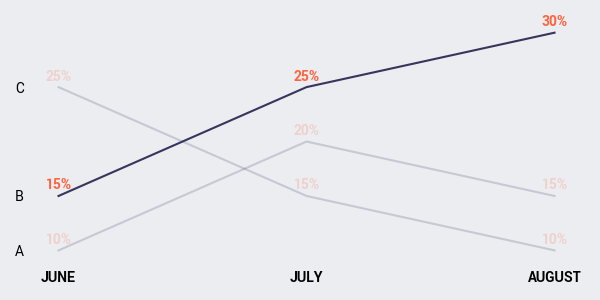
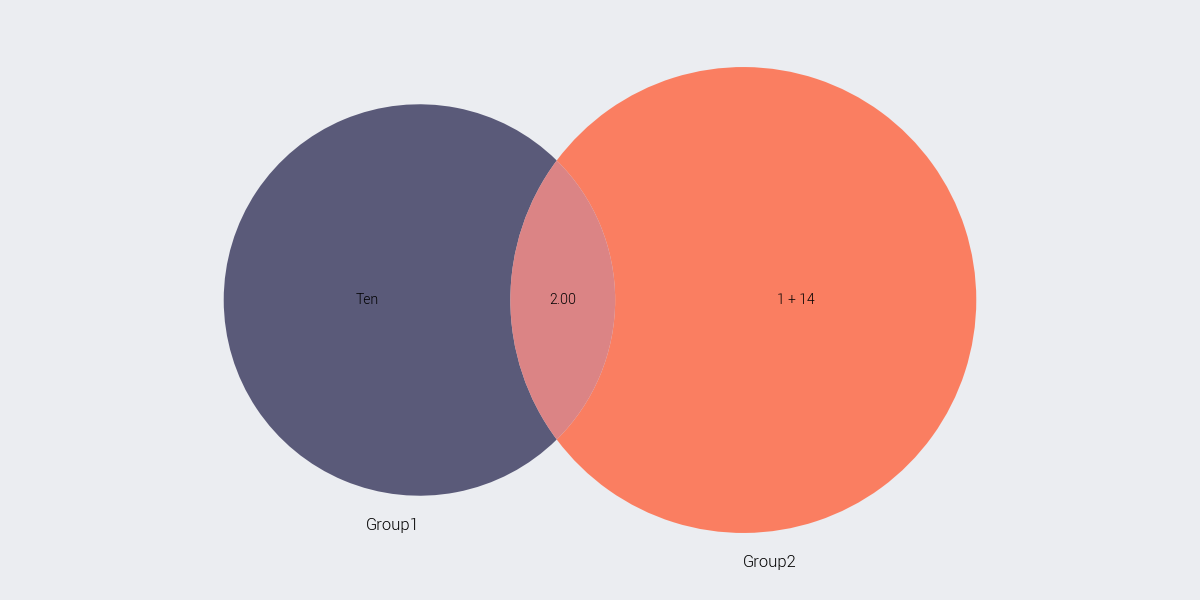
This wouldn’t be complete without some of the house’s favorites. Here are some
examples of the slope and Venn charts developed on the JPlotLib package.
Slope Plot
Venn Diagram
Bonus Points
You can also preset your brand’s color palette to define color maps. This ensures a clean and coherent look and your Marketing team will love you.


Wrapping Up / Keep in Mind
When it comes to data, appearances matter. Humans are visual learners so data visualization is a key in helping people understand what the data actually means.
It’s not just about making it “pretty”, if you are doing it right, chances are it will look pretty, but the main point is to make it readable, understandable.
Colors aren’t (or shouldn’t be) capricious, use them wisely! Same goes for any other element you are adding to your chart. Everyone should be able to grasp what the data is showing, with the least possible amount of effort.